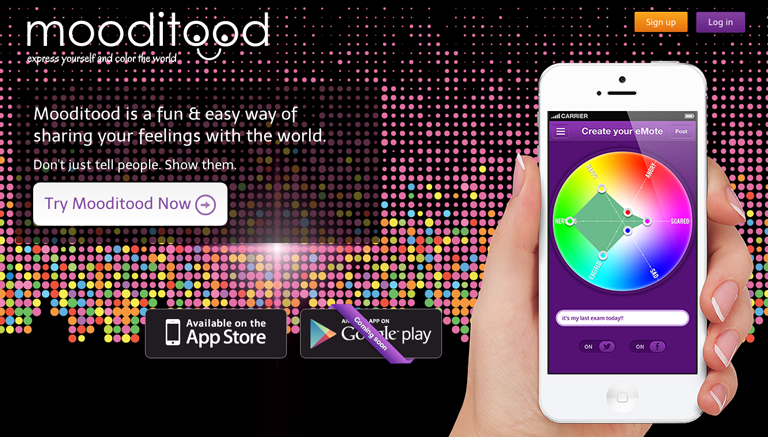
We’ve recently launched a new website and iOS app called Mooditood, which is an emotions based mood tracker built using what we think is a unique approach, and which solves a long standing issue of interpreting Twitter data quickly and easily.

The basic premise of Mooditood is simple: Twitter is a good tool for expressing yourself, but its impossible to get an overarching view of how the population are responding to any given event. Currently, the only option is to pick your topic and 1) read each tweet and try to gather a consensus view, or 2) hire an analyst to tap into the Twitter data-feed and interpret each tweet based on their own algorithm. The latter is increasingly common, and was done quite a bit in London during the Olympics last year (as an example).
The problems are obvious – reading tweets is time consuming and inherently unreliable (you’ll get sick of it after the top 20-30), and relying on an analyst means you only get one topic, and you’re dependent on their algorithm and method of interpretation (is someone putting 3 exclamation marks at the end of a sentence more excited than someone with only 2?).
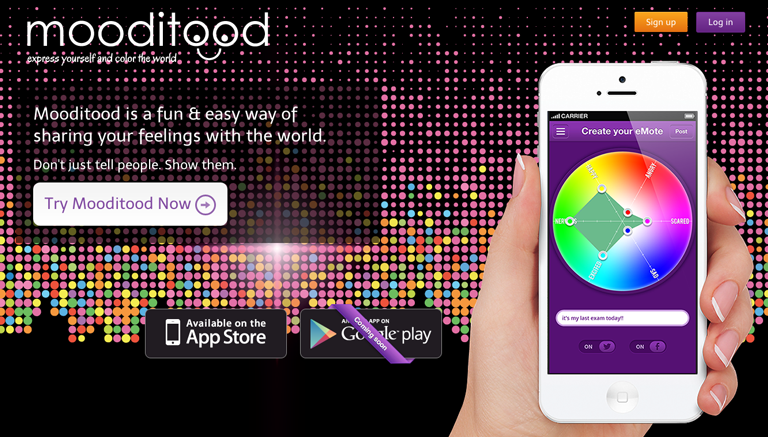
We’ve solved the problem with Mooditood. The user inputs their text (ie a tweet), but also selects an emotional input on each of six axes over a colour wheel (our moodsurface). Depending on where the input is on each axis, a blended colour is generated, meaning there are a near infinite number of potential colour outputs (technically 100^6), and thus a very highly textured emotional response. The combination of text plus color is called an eMote. When the user posts their eMote, it drops a pin the colour of the emotion on a map in their current location.
What you get, therefore, is a user generated map of colours for how everyone is feeling about any given topic at that moment in time. Users can then search for a topic, and get a visual interpretation of the current state of mind.
We’ve added other features to complete the offering – follow your friends, post to Facebook/Twitter, global/local emotion averaging and a few other things (including a location randomiser for those justifiably concerned about showing their precise location). The website was launched a few weeks ago, the iOS app hit the App Store yesterday, we’ll have an android app in the Play Store in the next few weeks.
We have a few development plans in place depending on how our userbase evolves over the next few months, including an iPad/tablet version. We’d love you to have a look at it, and we would of course be happy to discuss it with you.
Have a look at it – as the user base builds, the data becomes increasingly compelling.


